Single Metric Options
When you hover over a single metric widget, the Options icon (![]() ) will appear in the upper-right corner. The type of metric (indicator or time series) determines which options are available.
) will appear in the upper-right corner. The type of metric (indicator or time series) determines which options are available.
Single metric options can be set or removed across the entire dashboard at once. To do so, use the 3-dot menu at the top right corner of the dashboard.
The following describes how to apply single metric options to individual widgets.
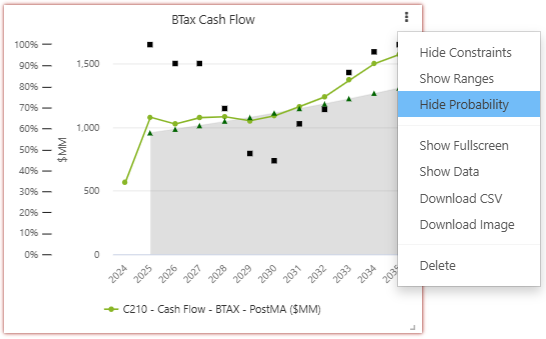
- Show / Hide Constraints – Select this option to display / hide the constraint on the chart. If no constraints have been set on the metric, the chart won't change. Red markers are used to indicate maximum constraints. Green markers are used to indicate minimum constraints. Grey markers are used to indicate constraints that are not being enforced.
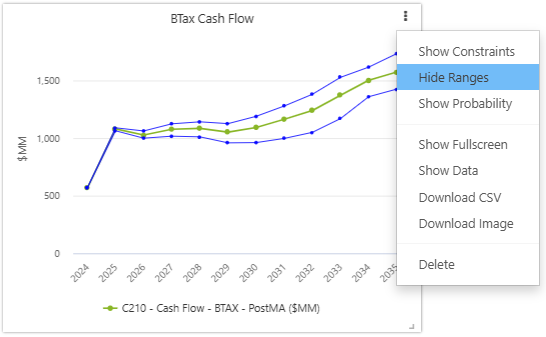
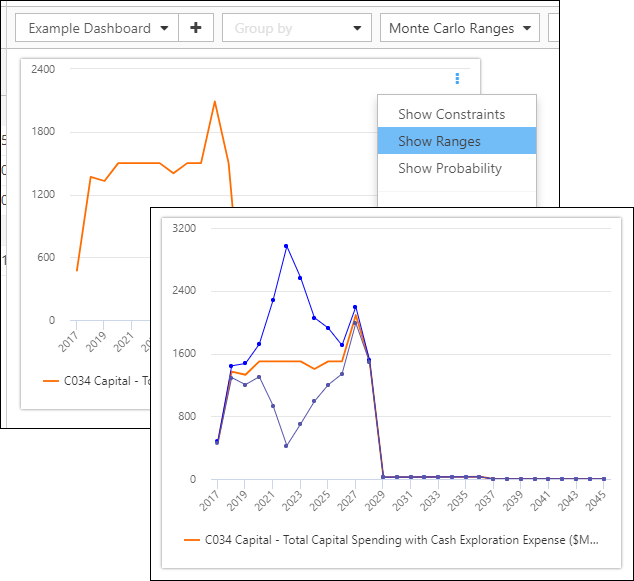
- Show / Hide Ranges – Select this option to display / hide ranges associated with the metric. Selecting Show Ranges will kick off a Monte Carlo simulation and display the results on the widget. See Monte Carlo Display for more information.
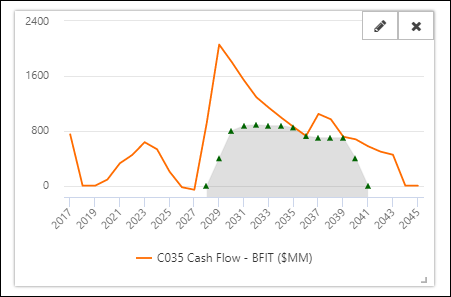
- Show / Hide Probability – Select this option to display / hide the probability of meeting the constraint(s) associated with the metric. If there are no constraints on the metric, nothing will plot. If the Monte Carlo simulation has not been run already, it will run when Show Probability is selected.

Click image to expand or minimize.


Only the ranges you've enabled using the Monte Carlo Ranges![]() drop-down menu will be displayed.
drop-down menu will be displayed.

- Delete will delete the widget.
The following additional options are available for time series metrics only:
- Show Ranges – Select this option to display ranges associated with the metric. Only the ranges you've enabled using the Monte Carlo Ranges drop-down menu will be displayed.
- Show Probability – Select this option to display the probability associated with the indicator. Probabilities represent the odds of meeting or exceeding targets.

Click image to expand or minimize.

Click image to expand or minimize.
